
K-Means clustering in action: an introduction to unsupervised learning
Explaining clusters and centroids, building the K-Means algorithm from scratch and visualising the algorithm's iterations.

Hello fellow machine learners,
Previously, we have discussed models that take a labelled dataset and aim to learn the patterns in the data to then predict labels for unseen data. Such models are called supervised learning algorithms.
The aim of today’s article is to introduce unsupervised learning, a paradigm of ML that’s quite different to what we’ve discussed before. Unsupervised learning algorithms are used when we have no labels for our data- rather, we trust the computer to come up with suitable labels and groupings for us.
Pretty crazy, right? The K-Means clustering algorithm is what we’ll use to showcase unsupervised learning in action.
We will begin with some mathematical notation before going through the algorithm step-by-step. As always, I will use colours as the labels for the data points for visual clarity 😎
By the end of this article, you will understand what’s going on in the below visual:
Now, let’s get to unpacking!
Terminology and notation
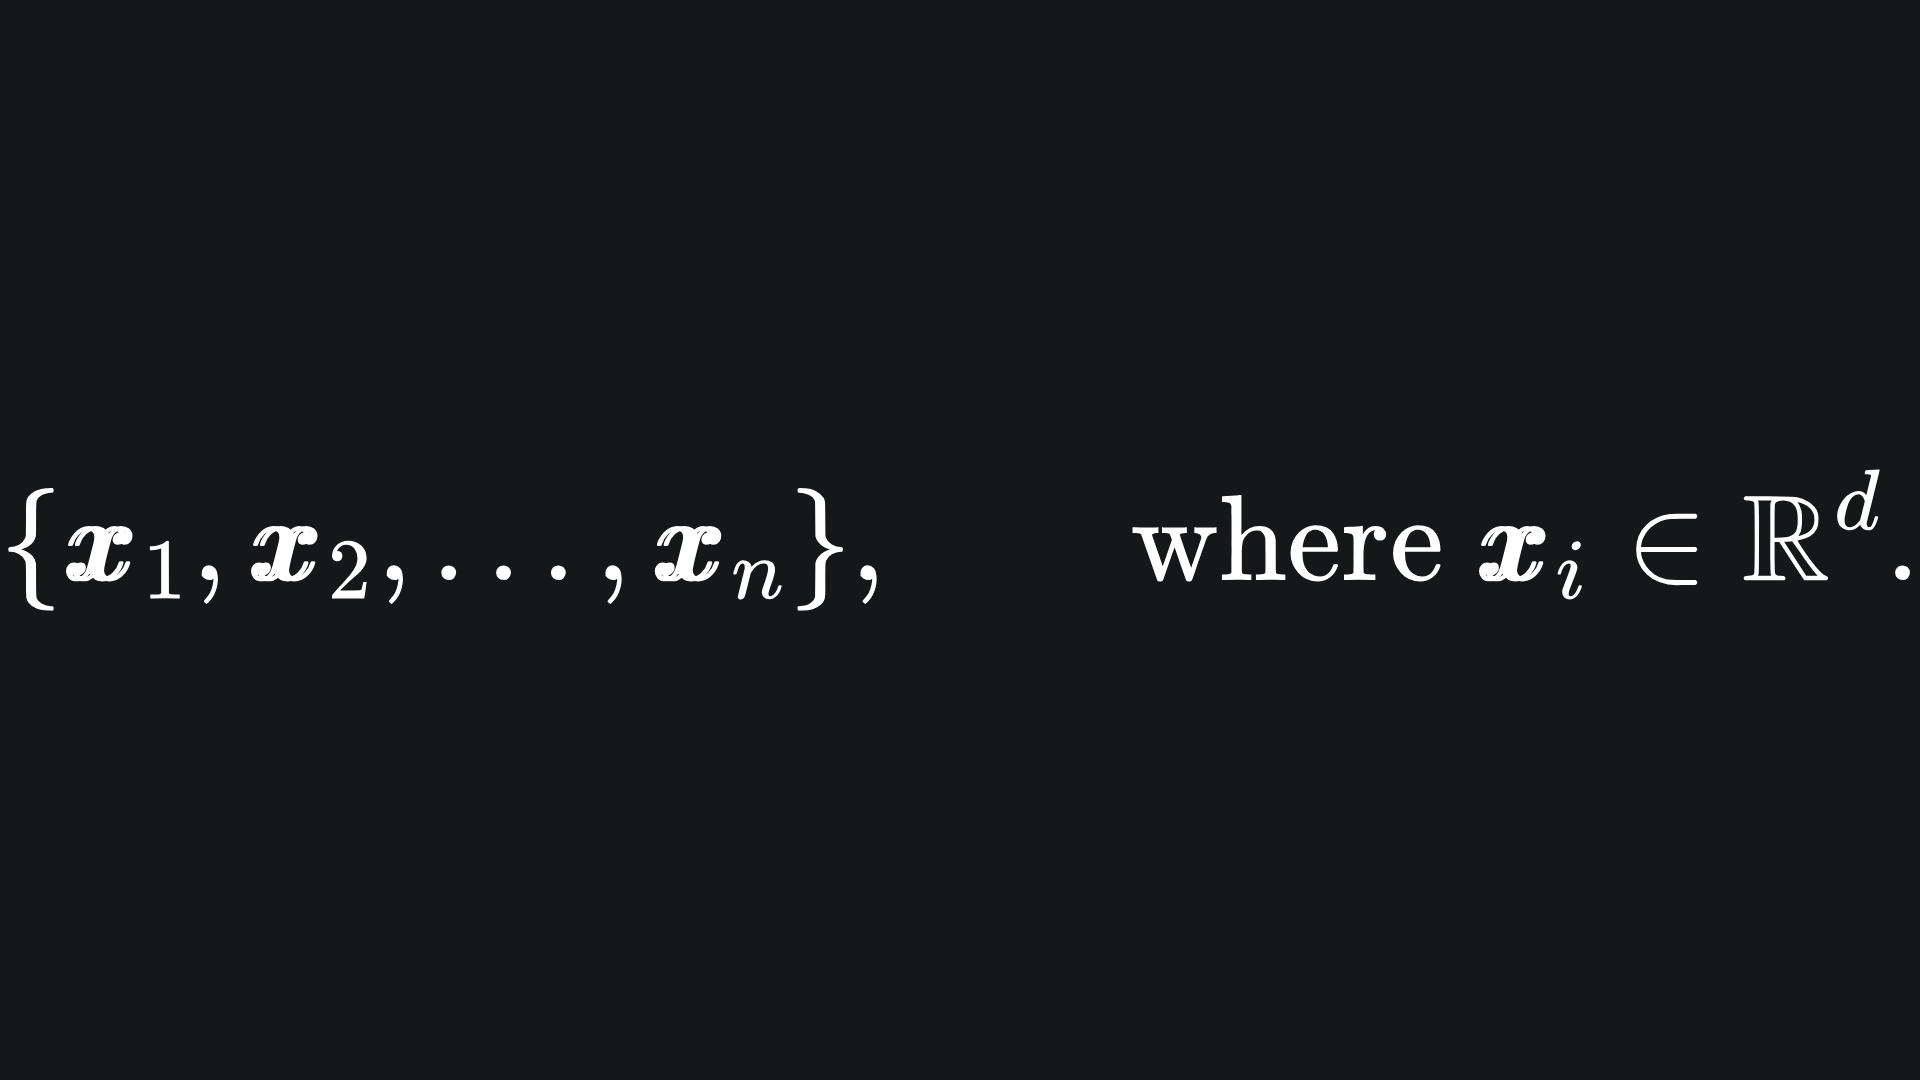
Suppose that we have n data points each in d-dimensional space1, i.e.
The goal is to assign a colour to each point from a palette C of k colours. We can just think of each colour as a number for now, i.e.
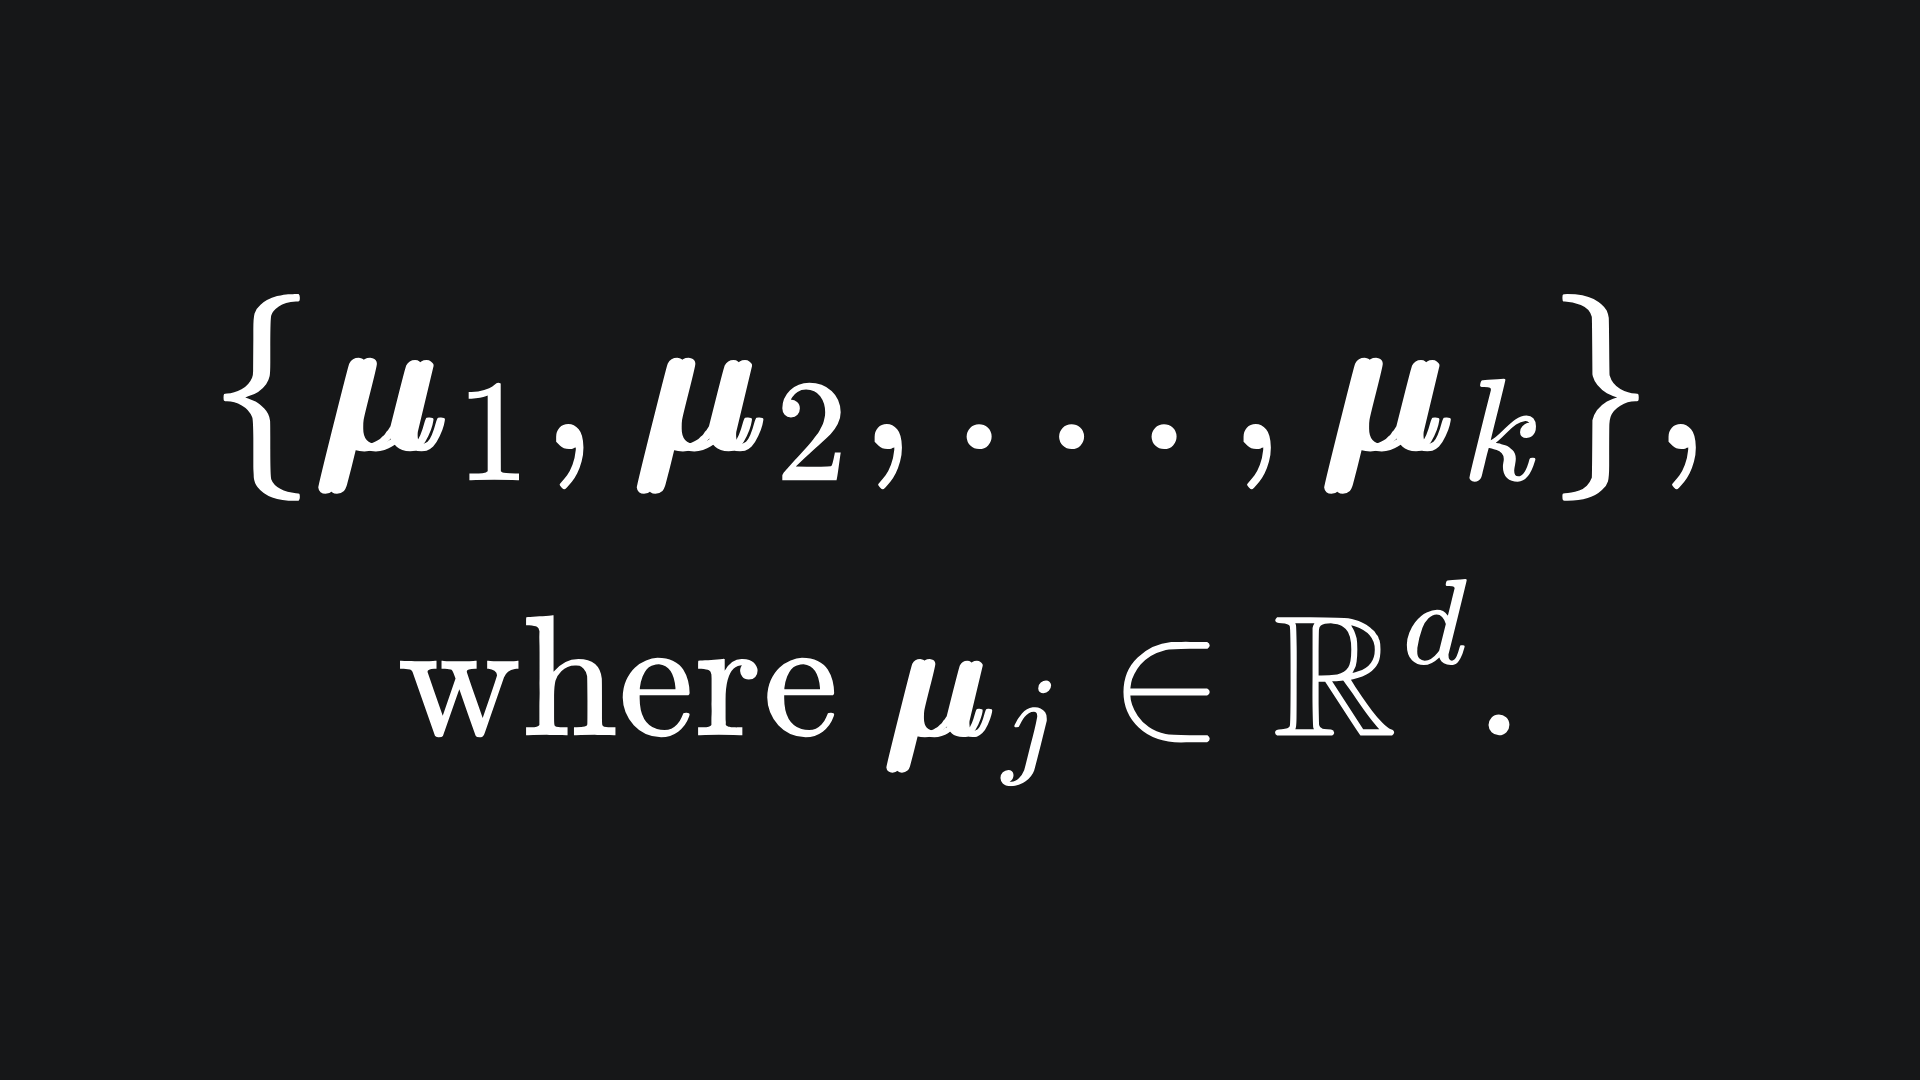
The idea behind the algorithm is to group the data points into k separate clusters and assign the colour i to all the data points in cluster i. To figure out where these clusters ought to be, we introduce k corresponding centroids, which are vectors that each lie at the centre of a cluster. They exist in the same space as the input data and so are also d-dimensional:
We aim to find good positions for these centroids by following a suitable algorithm, as detailed below.
Initialisation
We begin by setting the initial positions of the centroids at random.
One way to do this is by selecting k data points at random for our centroid starting positions. However, this can bias the starting positions of our centroids if the data points are not uniformly distributed in space.
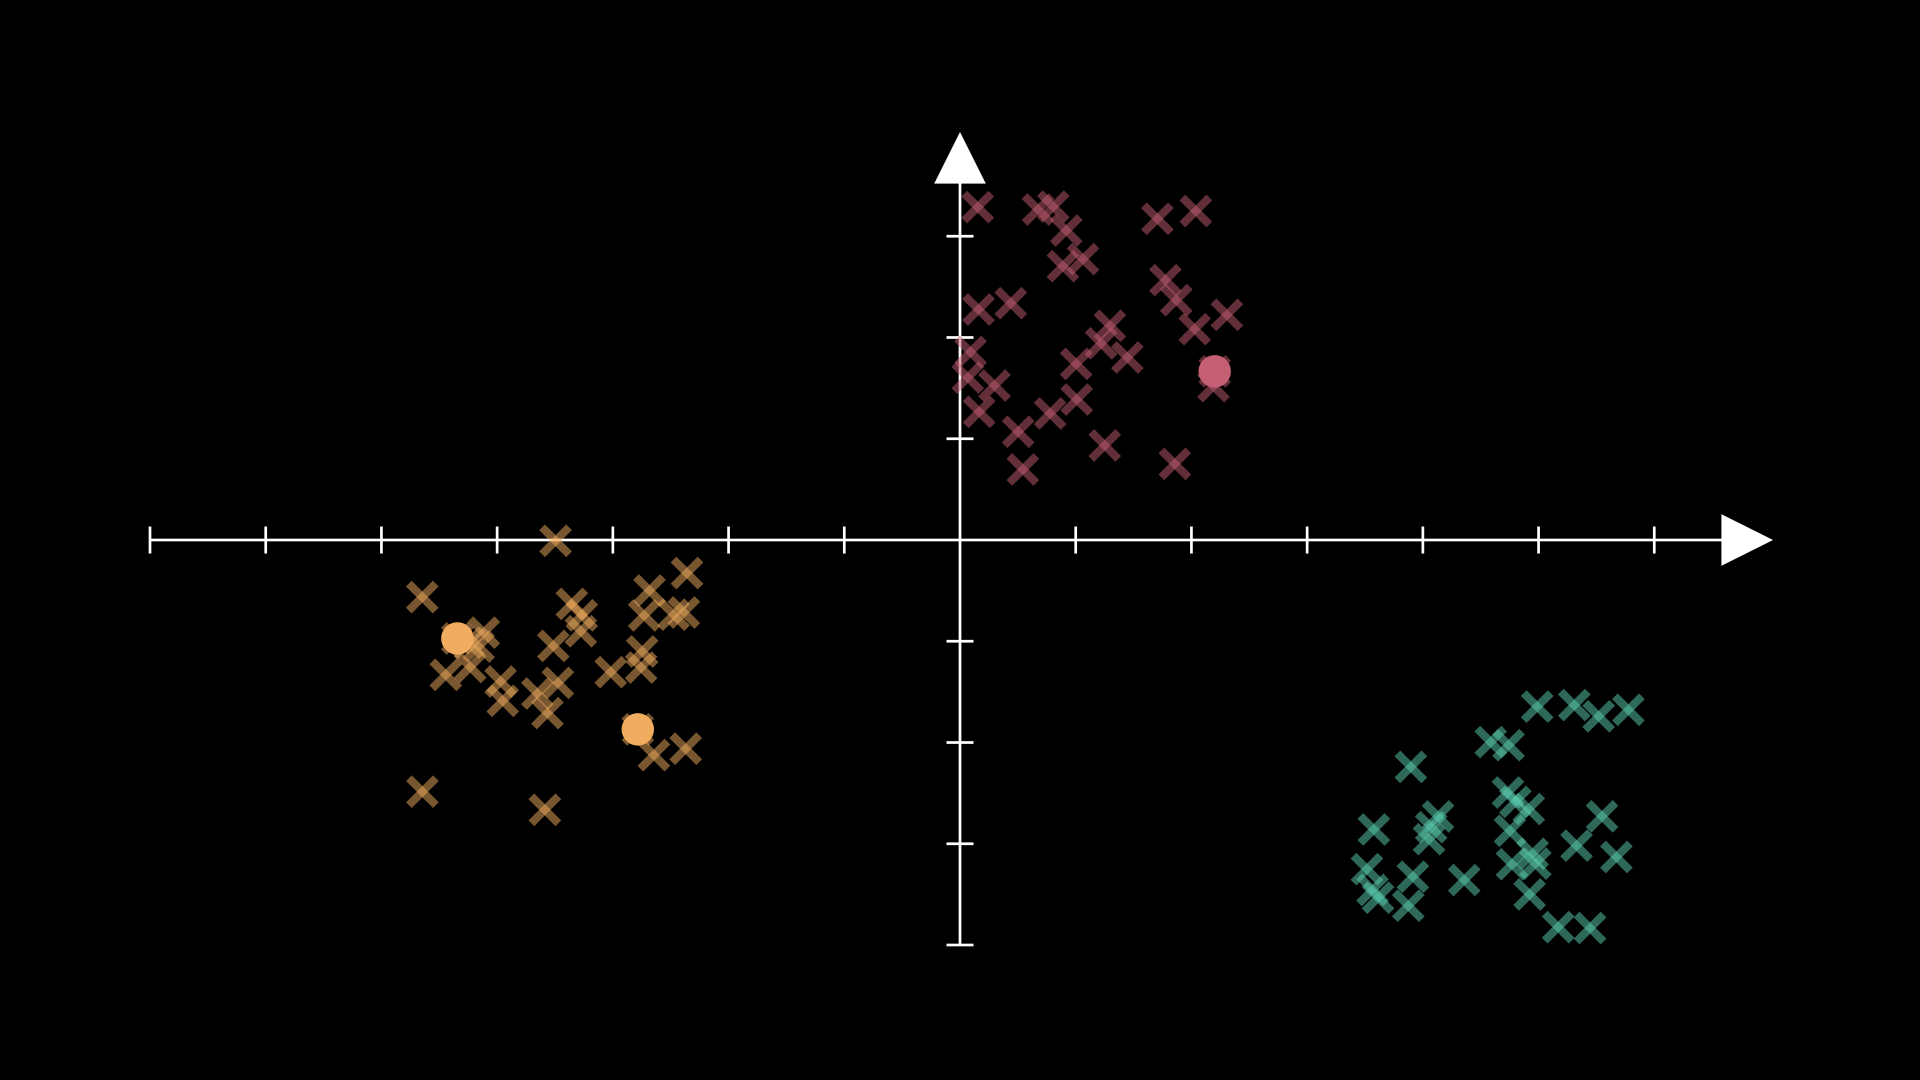
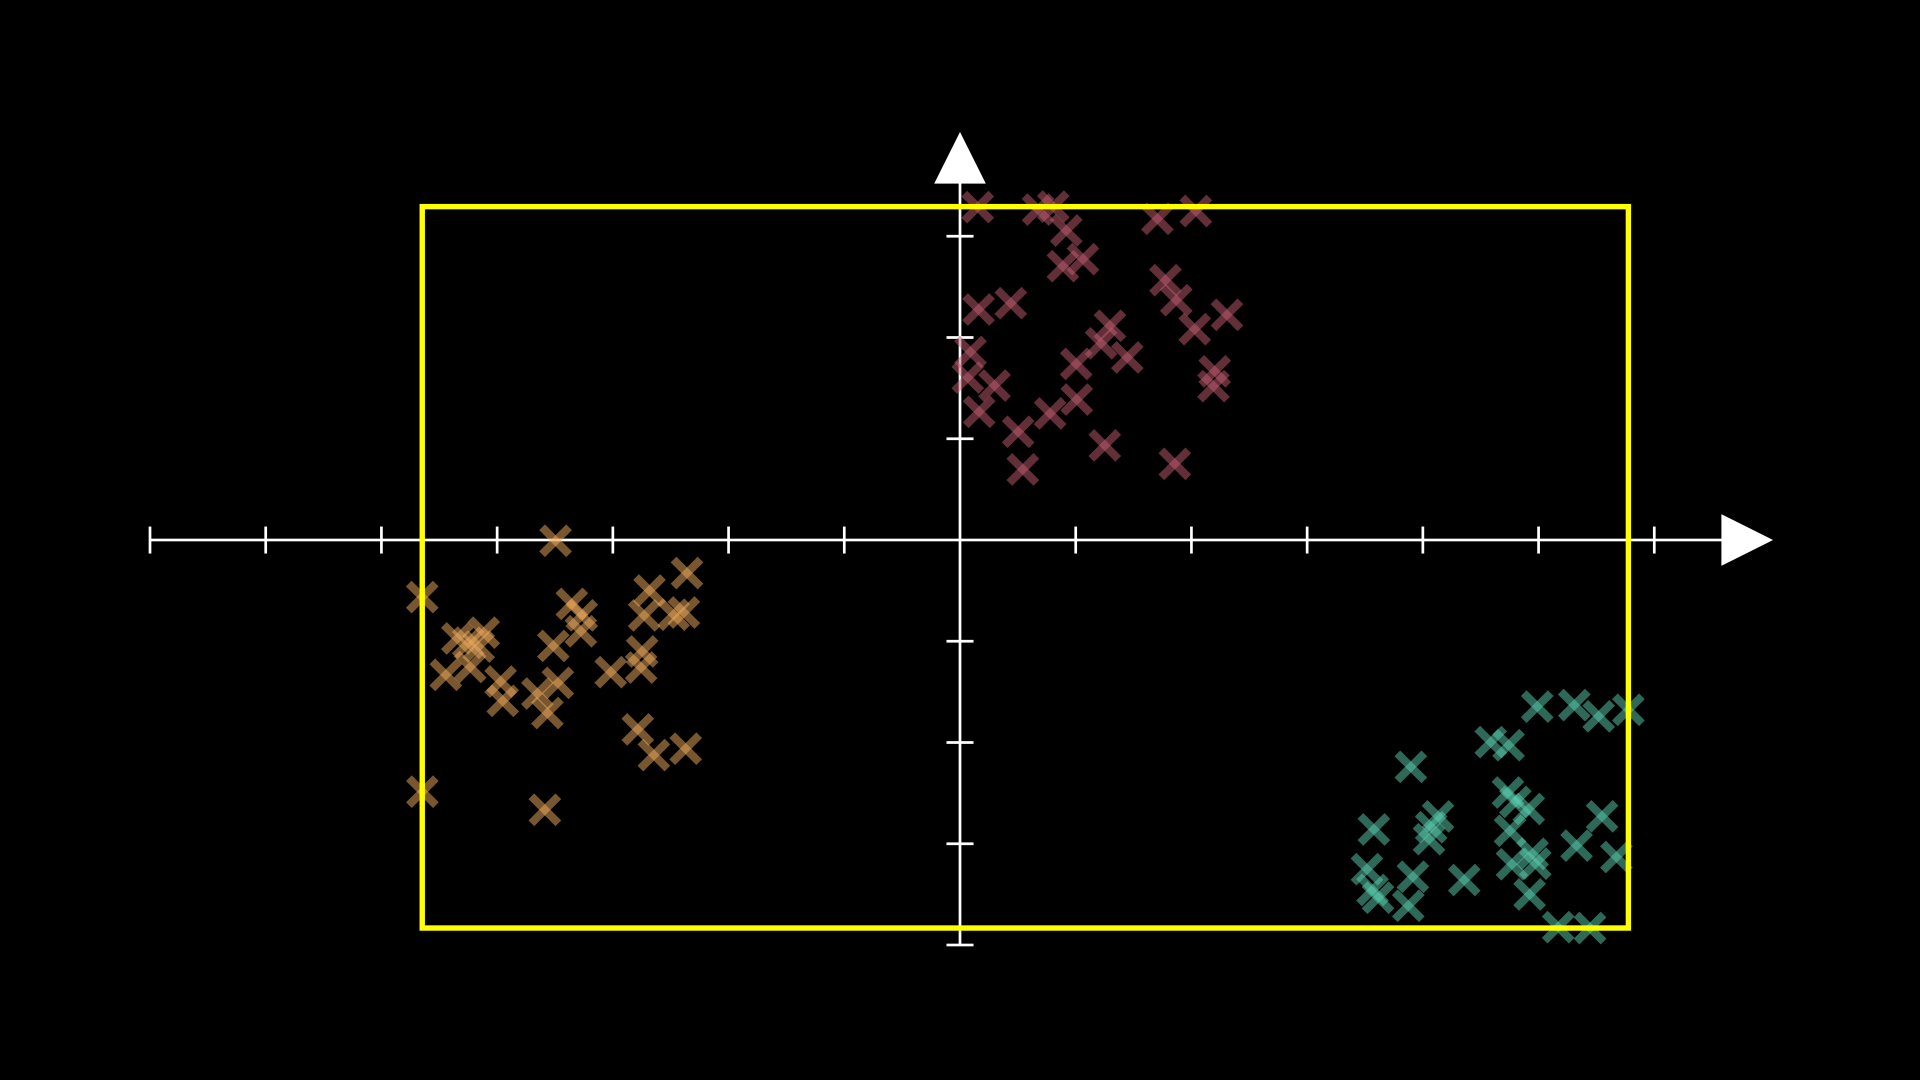
Consider the following data as an example, in which the data appears to follow a relatively neat clustering:

If we try to initialise our centroid positions with this method for K=3, then we could get two centroids in one of these groups:
This would force the algorithm to struggle unnecessarily.
A more suitable initialisation would be where we pick random coordinates in the smallest hyper-rectangle2 containing all our training data:
We can sample one set of coordinates for this with code like
data_min + np.random.uniform() * (data_max - data_min)
where data_min and data_max contain the smallest and largest coordinates in each coordinate direction respectively.
With this setup, we’re far less likely to end up with two centroid initialisations in the same cluster. Nice! There are other methods of initialisation, but this is the one I’ve gone with for today’s showcase.
Iteration
After initialisation, we assign colours to the data points, and then update the positions of the cluster centroids. We then repeat this process until the algorithm’s stopping criteria is met.
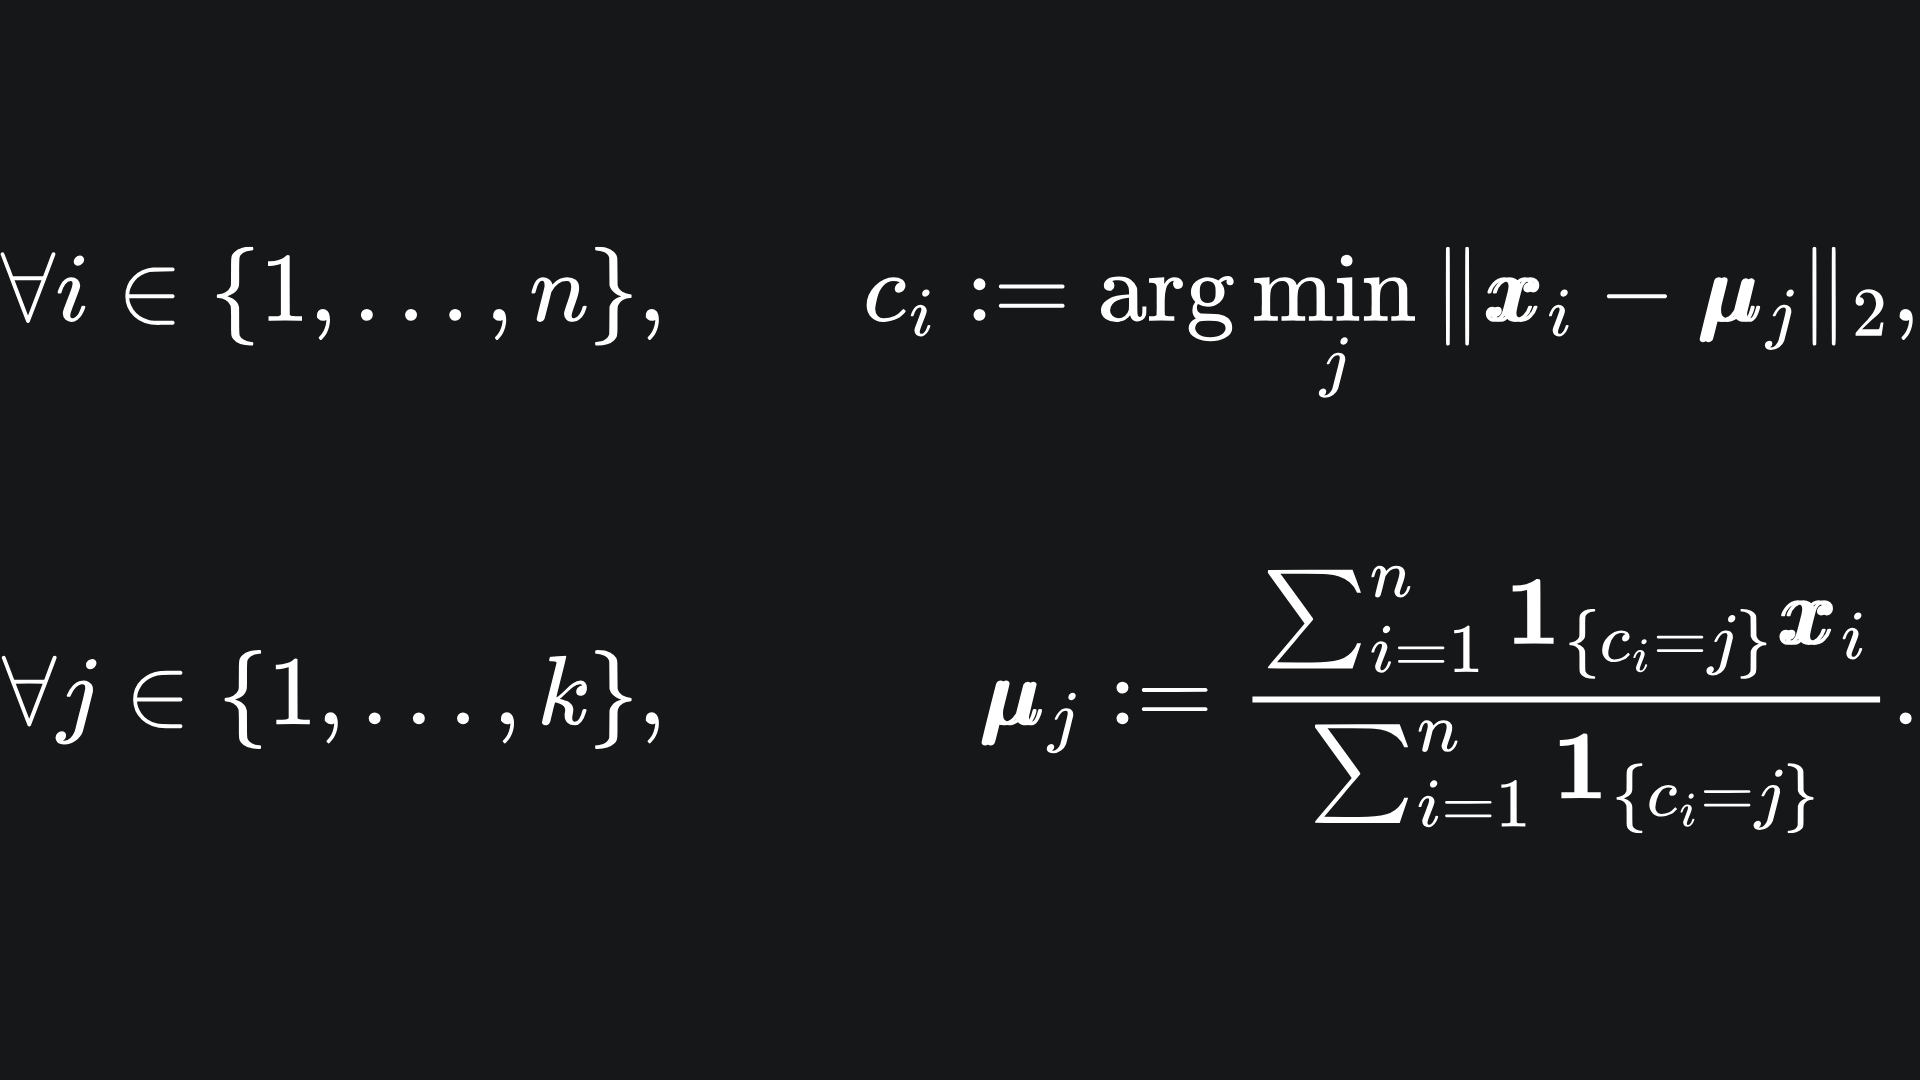
To update the colour of data point xi, we follow the formula
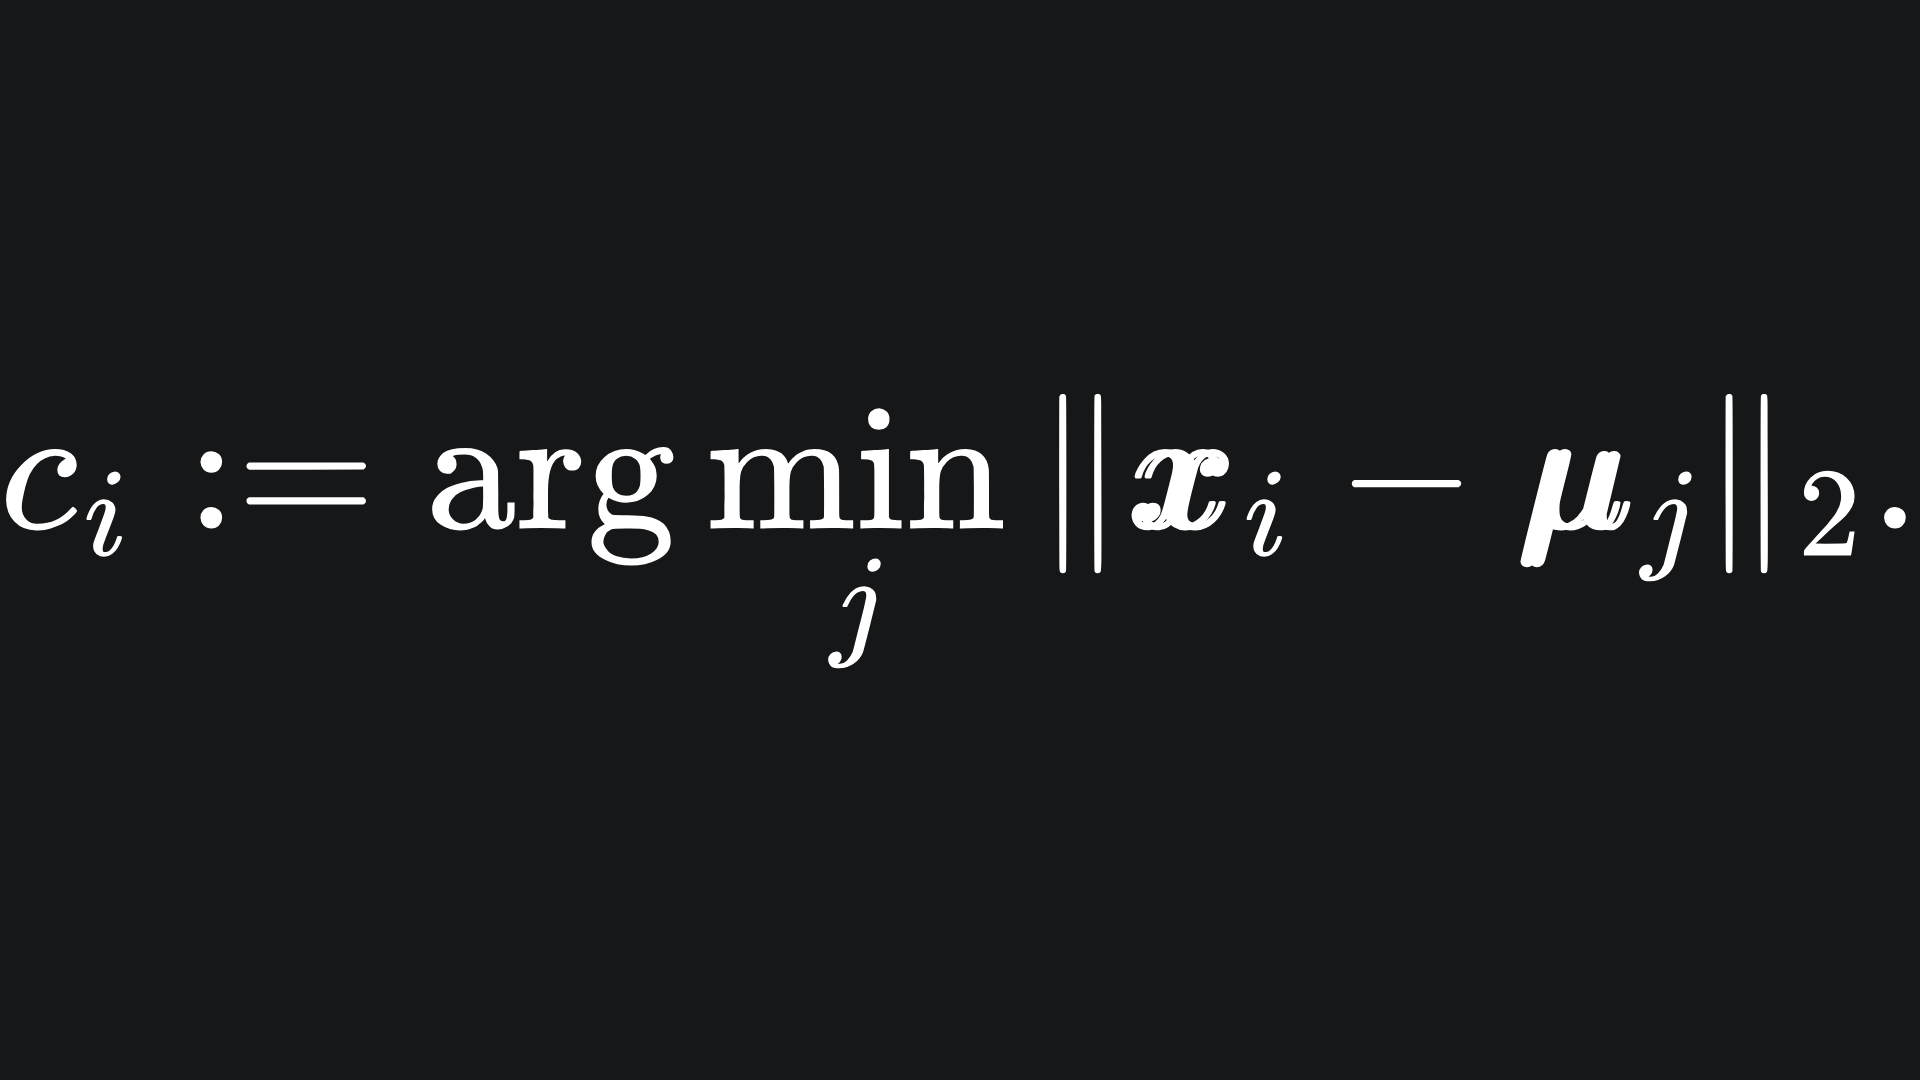
Essentially, we find the index of the centroid that the data point xi is closest to, which corresponds to one of our colours. We do this for all the data, i.e. for all i from 1 to n.
Now to update the locations of the centroids. To update centroid μj, we follow the formula:
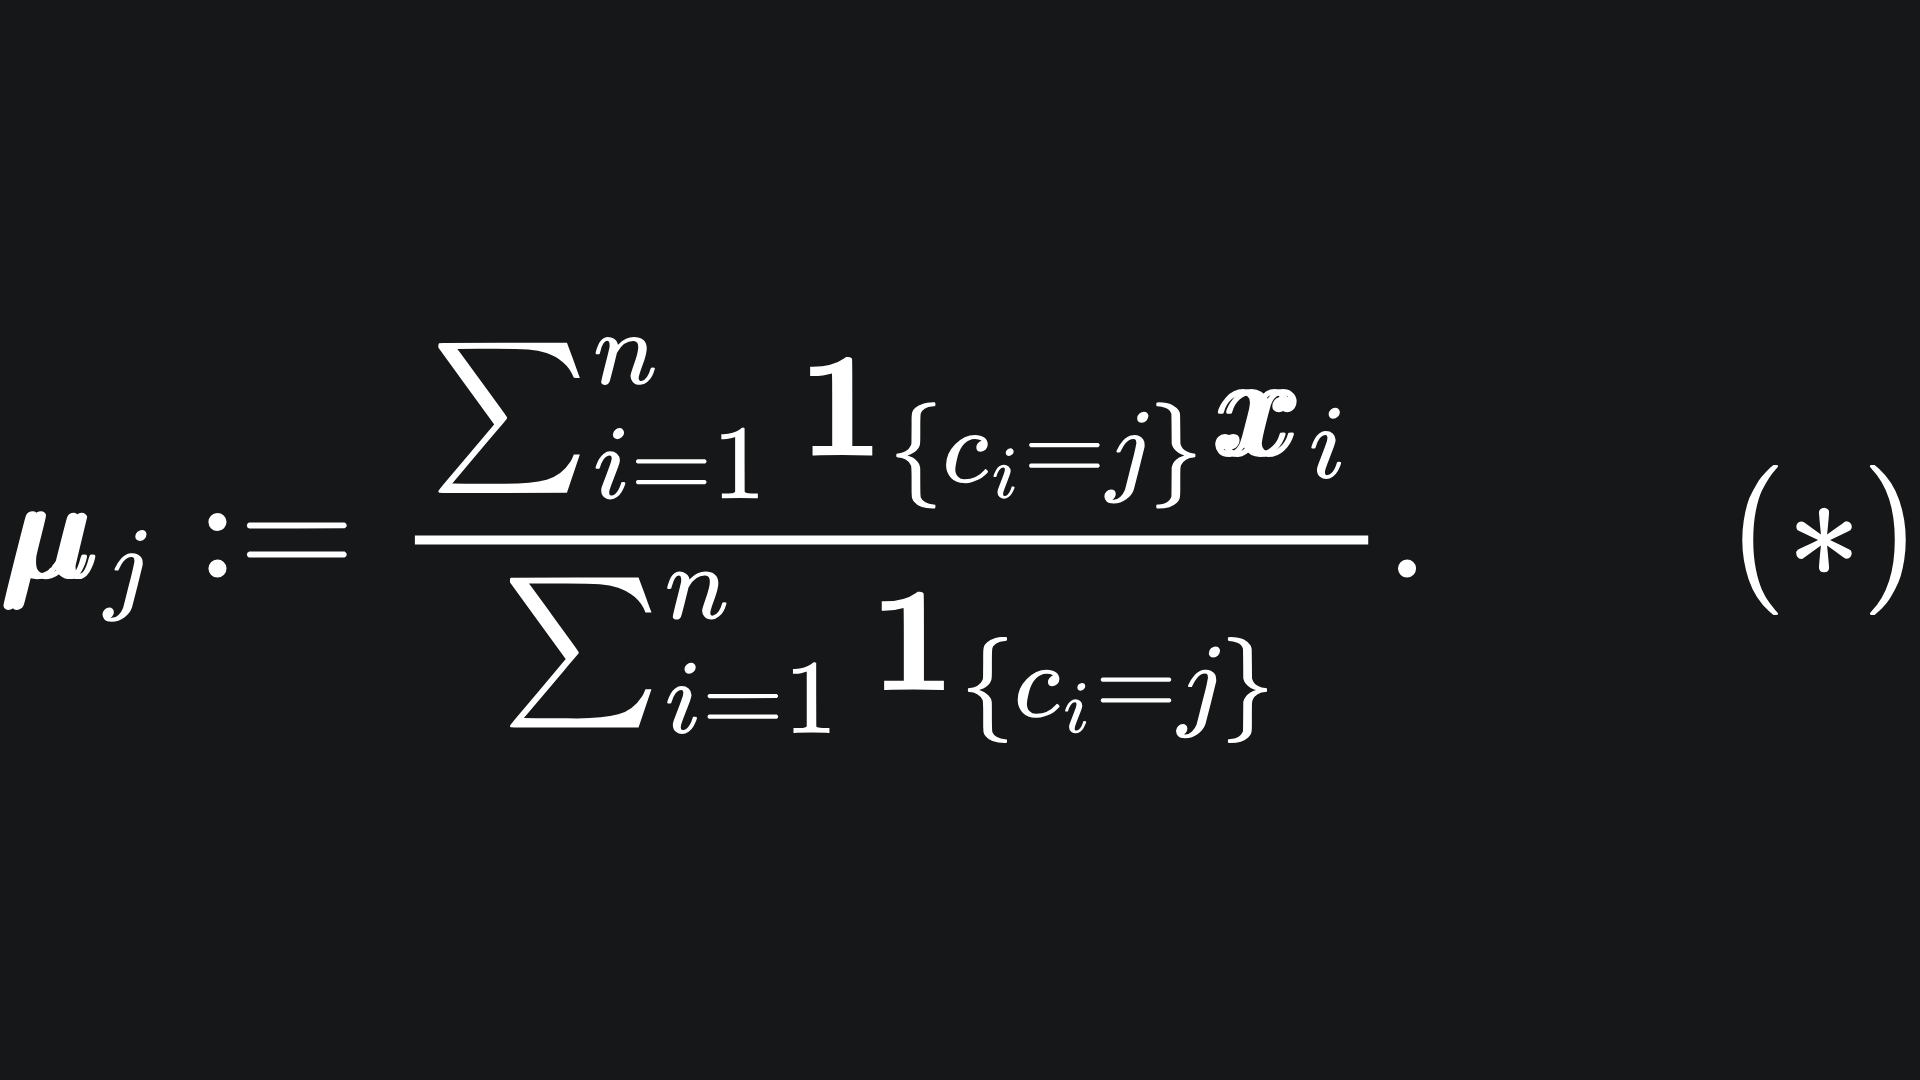
Yikes… what’s going on here? Don’t worry- . The fancy-looking ‘1’ thing is the indicator function, which is defined here as
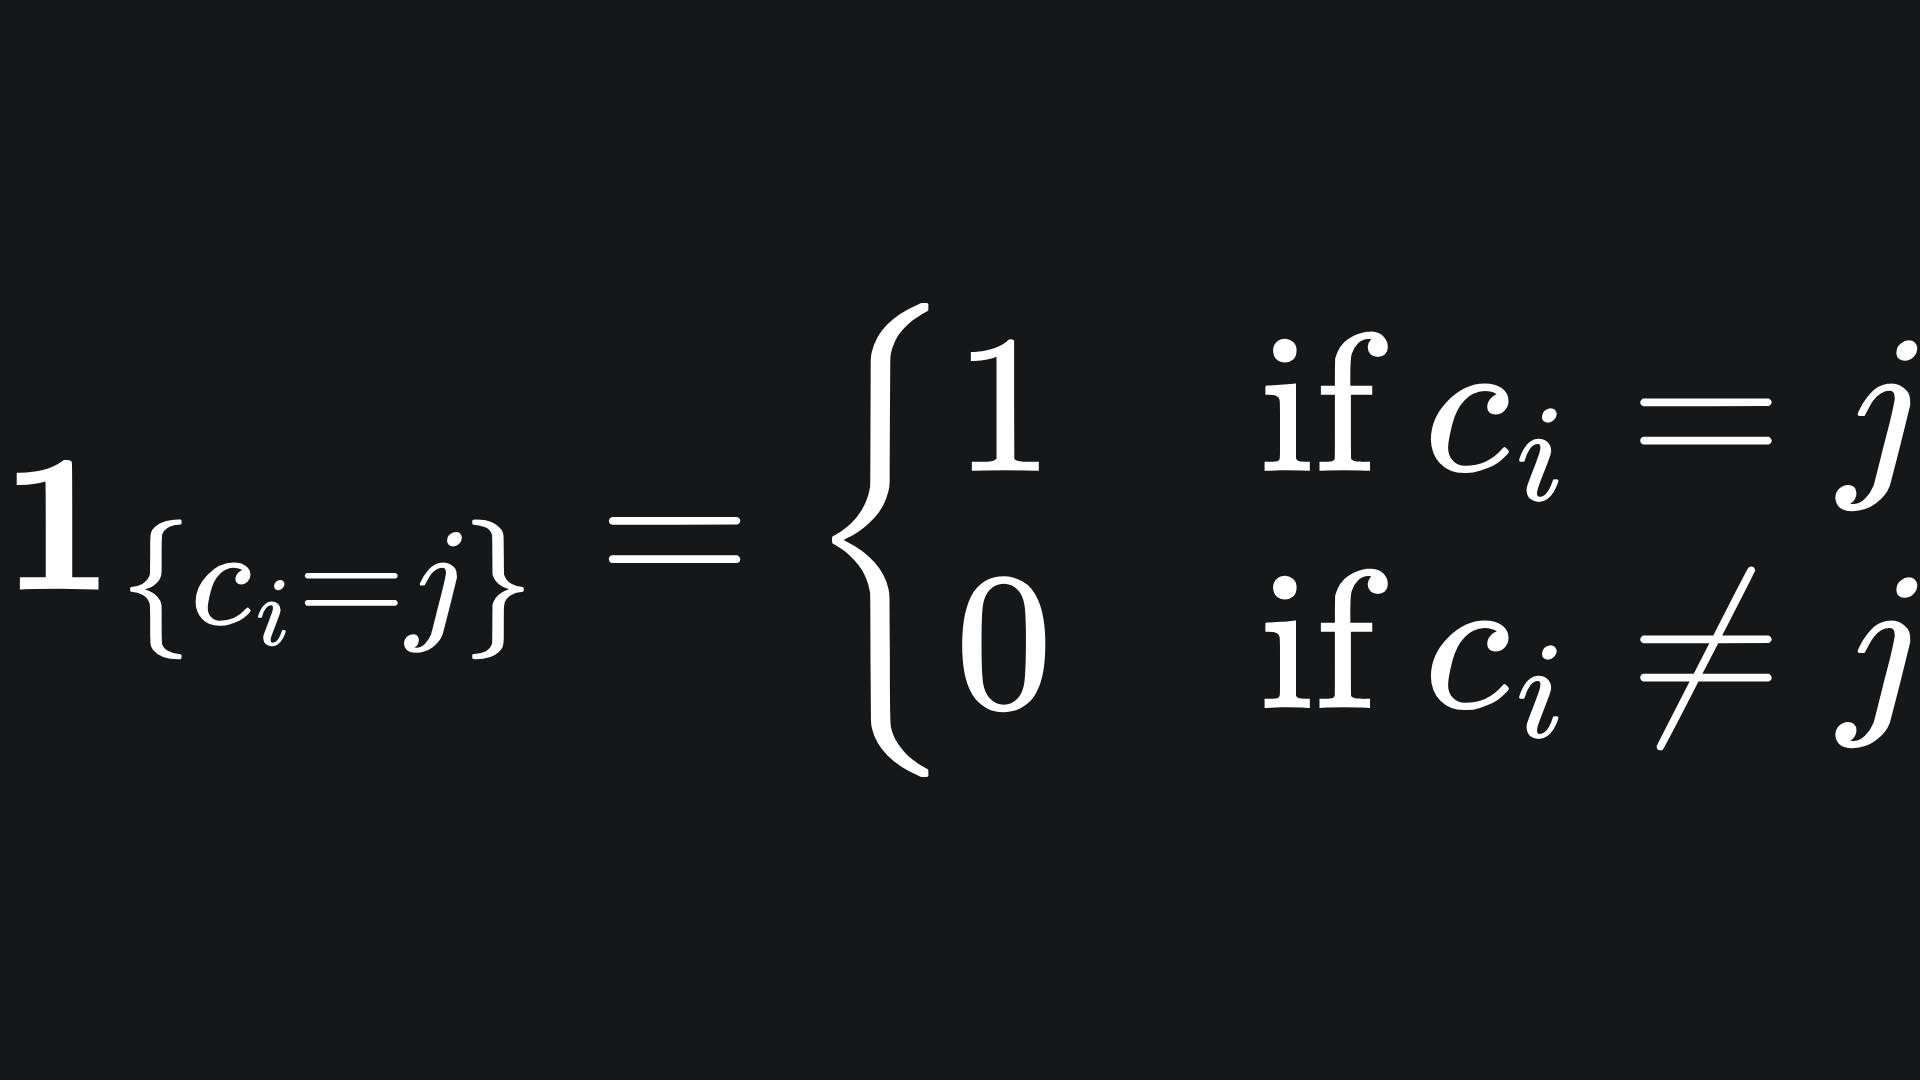
So the denominator of (*) just counts the number of points in cluster j, while the numerator adds together the coordinates of the points that are in cluster j.
Putting these together, we see that the new position of centroid j is the average of the coordinates of the data points in cluster j. But we mathematicians like to overcomplicate things with complex-looking notation 😀
When do we stop?
We can choose what stopping criteria we wish to put in place. For my K-Means implementation, I chose to stop the algorithm when either:
🏁 The total deviation of cluster centroids from the previous iteration is no longer large enough to warrant another iteration. The total deviation is given by the sum of the distances each centroid moves by from the previous iteration to the current one. If the total deviation is sufficiently small, then we conclude that the algorithm has stabilised a sufficient amount. We can set the parameter TOL to control how much the centroids need to move around by in total.
🏁 We exceed a pre-specified number of iterations, given by the constant MAX_ITER. This may be ideal if you have a limit on computational resources, or if the algorithm fails to stabilise naturally after a reasonable length of time.
The K-Means algorithm
Just to summarise the above:
First, initialise the k centroids at random.
Then, repeat the following until the stopping criteria is satisfied:
K-Means in action
Going back to the animation at the beginning: does it all make sense now?
(The grey dots are the points where the centroids will end up, I have left them in so you can map the trajectory of each centroid.)
What’s the best value for K?
The bad news is that you will have to experiment with the value of K to achieve a good set of clusters.
The good news is that I have written all the code up for you to experiment and play around with. Check out k_means.py and k_means_manim.py in the following GitHub repo: https://github.com/AmeerAliSaleem/machine-learning-algorithms-unpacked
The former file includes the code for the K-Means algorithm from scratch, and the latter contains all the Manim code for the animation from today in the kMeansVisual class.
(The code for all my other articles can be found in this GitHub repo too!)
Packing it all up
And that’s all3 for this week! Here is the usual roundup:
Clustering is an unsupervised learning technique that can be used to group together data points when we don’t have a labelled dataset.
The aim of the K-Means clustering algorithm is to stabilise the centroids of each cluster through an iterative process of reassigning centroid coordinates and data point clusterings.
Typical termination criteria include a cap of the number of iterations and a total centroid deviation that must be exceeded at each iteration step.
Training complete!
I hope you enjoyed reading as much as I enjoyed writing 😁
Do leave a comment if you’re unsure about anything, if you think I’ve made a mistake somewhere, or if you have a suggestion for what we should learn about next 😎
Until next Sunday,
Ameer
PS… like what you read? If so, feel free to subscribe so that you’re notified about future newsletter releases:
Sources
“K-Means Clustering Algorithms: A Comprehensive Review, Variants Analysis and Advances in the Era of Big Data”, by Abiodun M. Ikotun et al: https://www.sciencedirect.com/science/article/abs/pii/S0020025522014633
“Learning the K in K-Means”, by Greg Hamerly and Charles Elkan: https://www.researchgate.net/publication/2869155_Learning_the_K_in_K-Means
Stanford lecture notes on the K-Means algorithm: https://cs229.stanford.edu/notes2020spring/cs229-notes7a.pdf
A great YT video that helped me understand how to write the K-Means algorithm from scratch.
My GitHub repo where you can find the code for these articles: https://github.com/AmeerAliSaleem/machine-learning-algorithms-unpacked
I use bold letters to represent vectors.
Recall that the prefix ‘hyper’ just extends our base terminology to higher dimensions. E.g. rectangle in 2D, then hyper-rectangle for higher dimensional spaces.
I say “that’s all” but this one took quite a while to put together 😭